Purpose
With the recent passing of bills in Ohio, Georgia, Alabama, and Missouri restricting women's access to abortions -- a few amongst many "heartbeat bills" in the works throught the States -- along with the proposal of bills such as those in Ohio which would restrict most forms of women's birth control, women's reproductive rights have come to the forefront of the national conversation.
As I enter a new phase of my life after graduation and have the option of relocating, I determined that it would be helpful to have a resource on hand which determines the levels to which each state's legislations support women's reproductive rights, including access to contraceptives, rather than a sole focus on abortion.
Hypothesis
My hypothesis was that the states which have earned recent media attention for their abortion laws, such as Georgia, Ohio, and Alabama, would reflect a high degree of hostility towards women's reproductive rights overall.
Methodology
Scoring Methods
I got the information that I used to base my scores off of from The Guttmacher Institute. These scores were tallied and the total scores were calculated in an excel document, which you can download here. I will link to each of the data tables I used as part of the total scores, and describe the reasoning behind the scores given.
It is important to note that I did not assign scores based on states' policies regarding State abortion bands by gestational age, or on Bans on Specific Abortion Methods Used After the First Trimester. The data within these two areas makes scoring difficult, in no small part due to the sheer number of policies which are not in effect due to a court order, as well as the questional nature of determining policies based on the week of pregnancy and the variation in actual pregnany length caused by basing it off of a woman's last menstrual period (LMP).
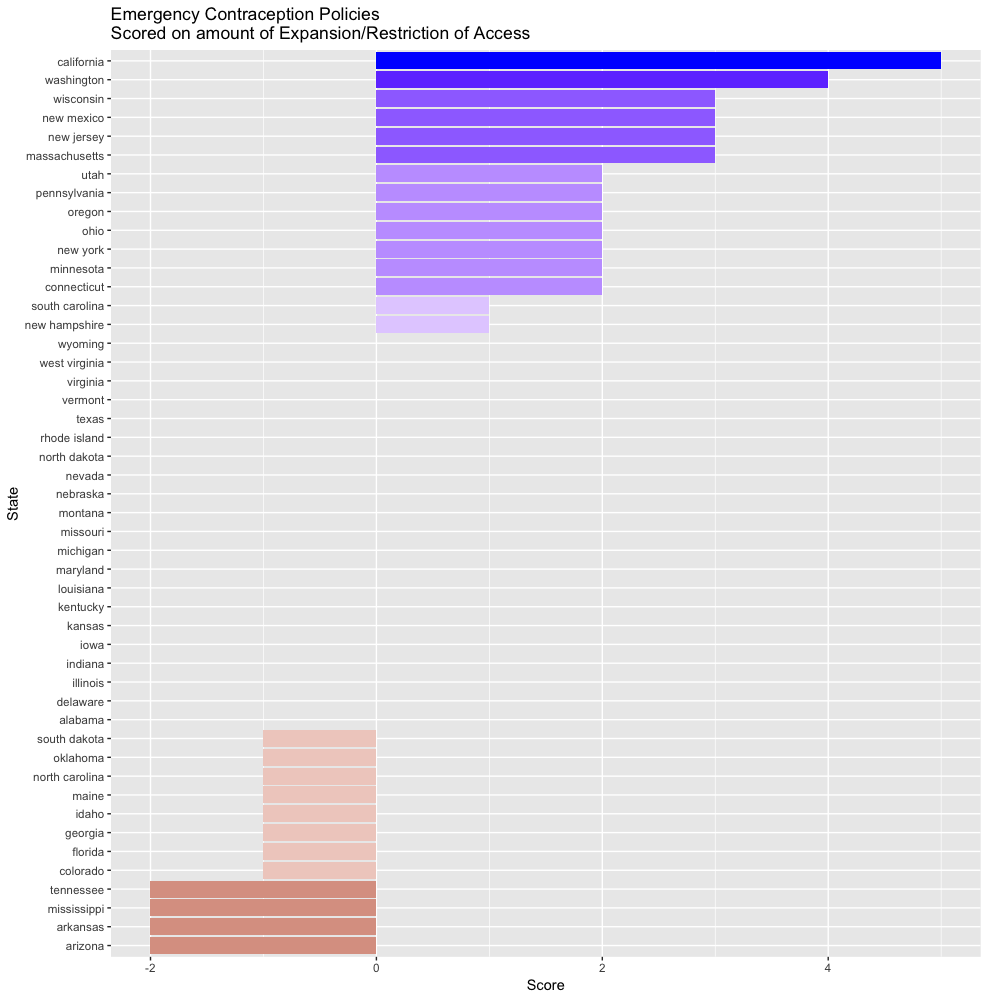
Emergency Contraception Policies
View the source data here.
This data is divided into two main categories: Expanding Access and Restricting Access.
For every mark under the Expanding Access category, one point was added to a state's score.
Similarly, for every mark under the Restricting Access category, a point was deducted from a state's score.
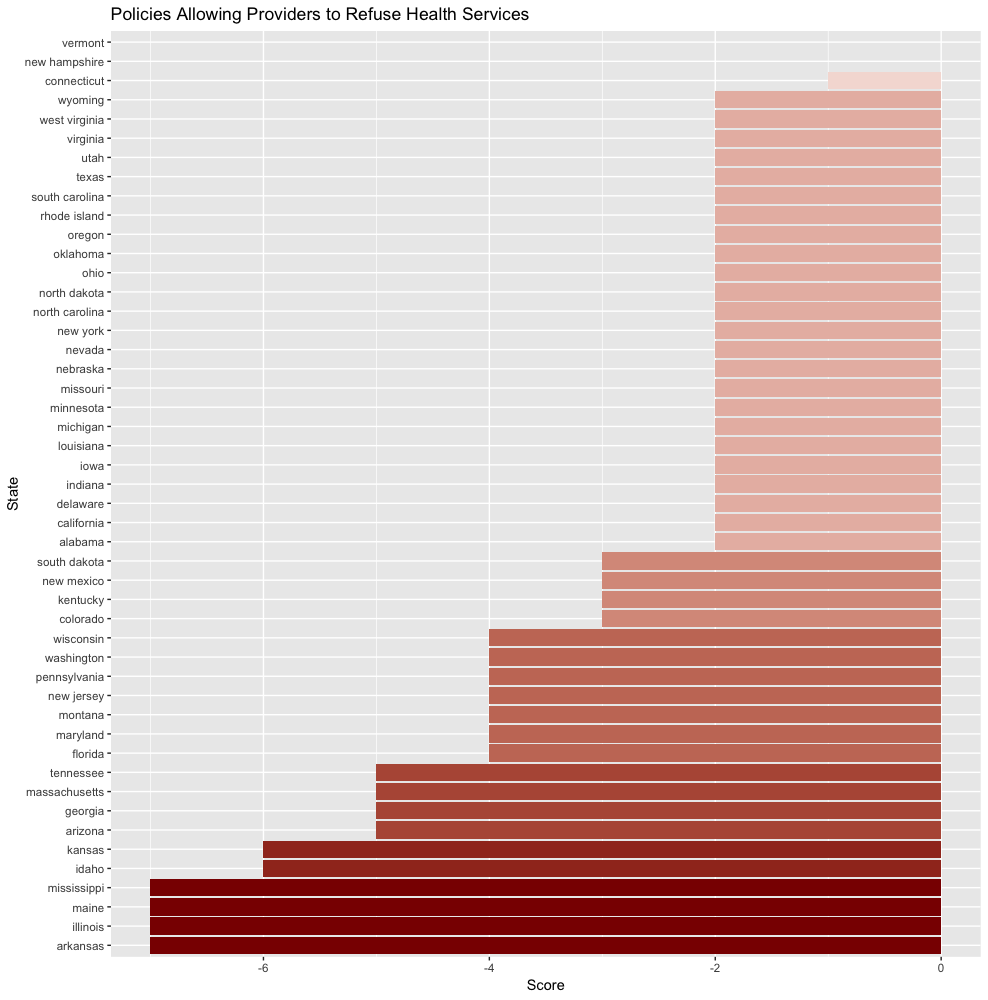
Policies allowing providers to refuse
View the source data here.
Because this data only covers cases of refusal, points were only reduced from states' scores under this category.
For each mark a state was given in this table, its score was reduced by one point.
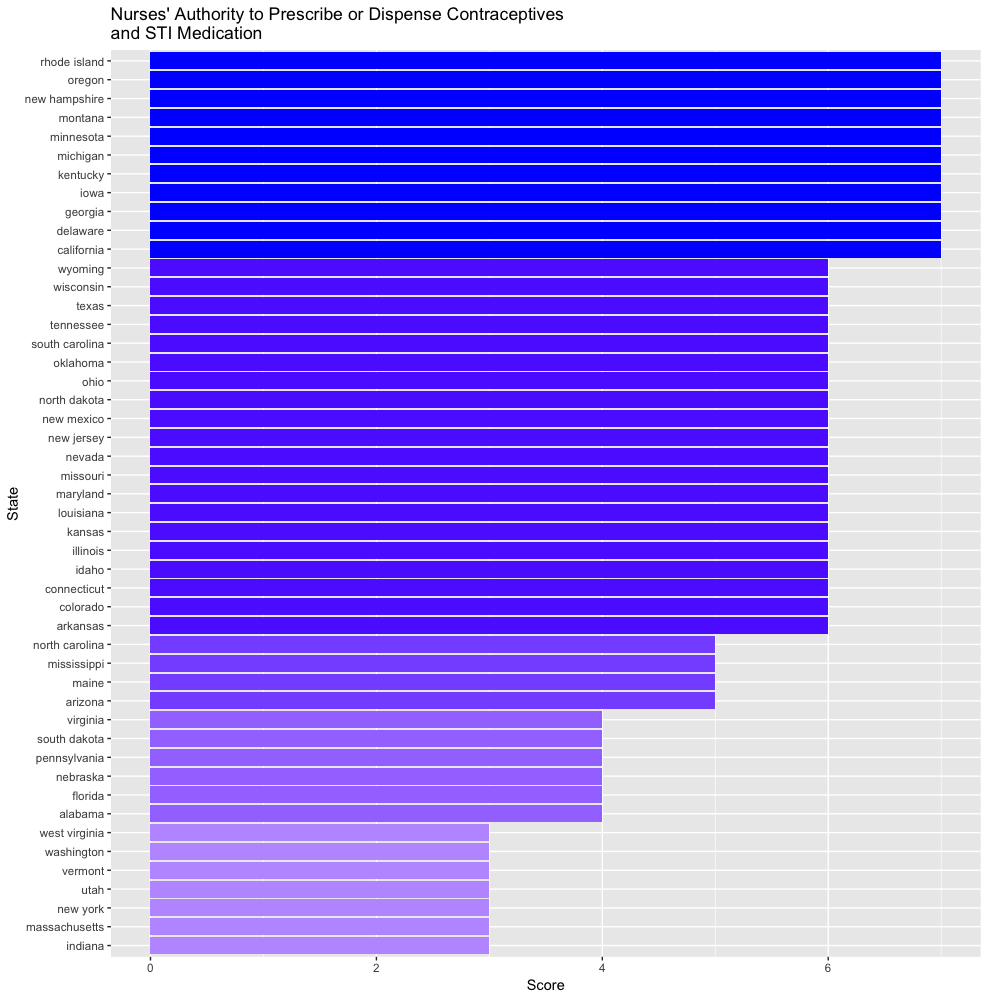
Nurses’ Authority to Prescribe or Dispense
View the source data here.
Because this data only covers cases of allowing access, points were only added to states' scores under this category.
For each mark a state was given in this table, its score was increased by one point.
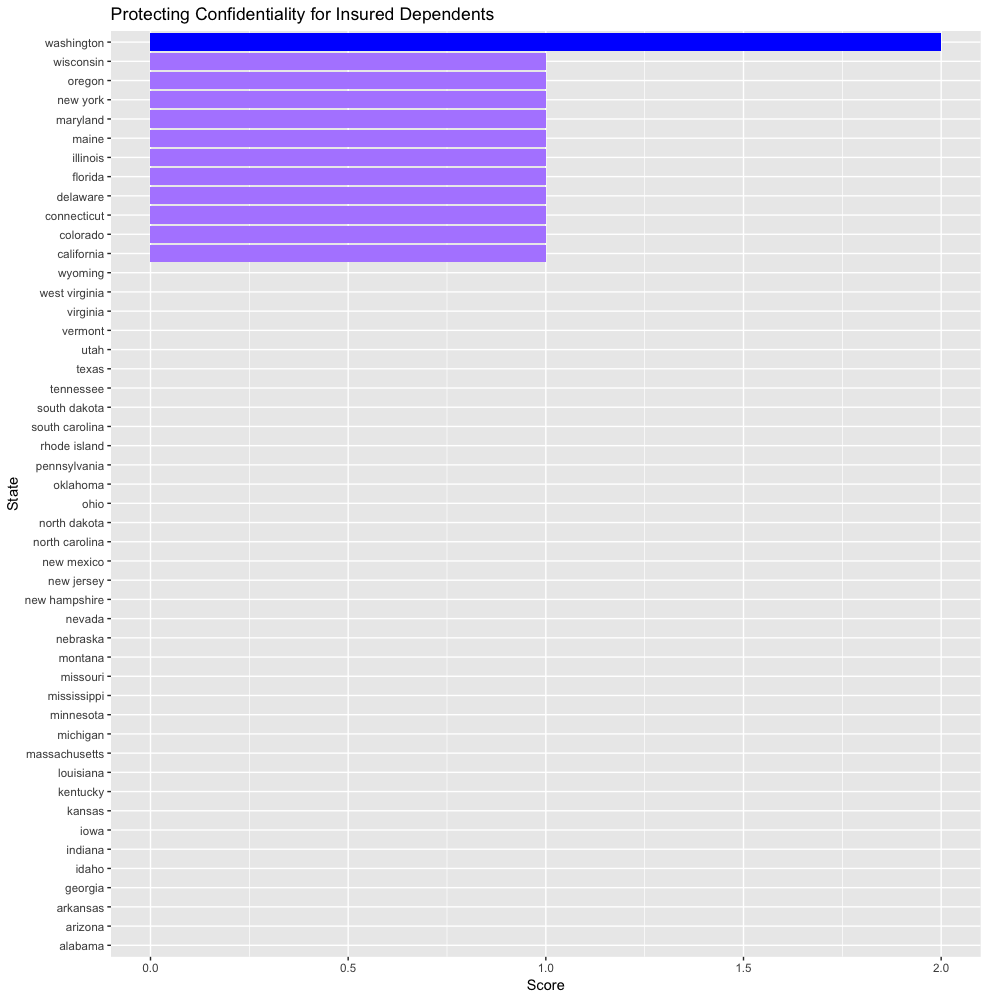
Protecting Confidentiality for Insured Dependents
View the source data here.
This small dataset addresses protections for people seeking medical care, and as such saw only score increases.
For each category where a state was given a mark, their score was increased by one point. This resulted in a one point increase for all listed states except for Washington, which gained two.
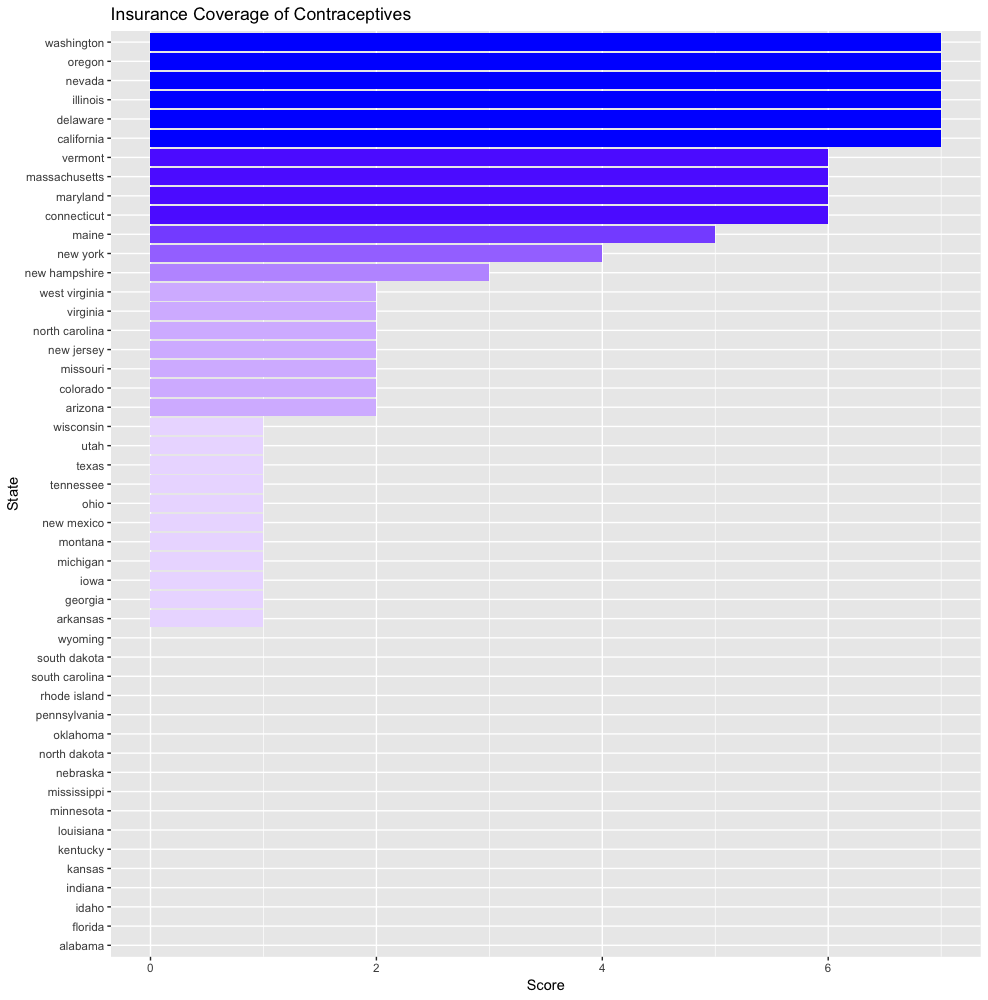
Insurance Coverage of Contraceptives
View the source data here.
This data covers both the protection and restriction of access to contraceptives.
While the restrictions were limited to two columns under "Refusal provisions," the scope of this refusal had its own subset of options, so I determined that it would be clearer to give the refusal provisions their own chart (scoring methodology described below).
As such, this chart only contains score increases.
For each mark not included under refusal provisions, states were given one point.
Coverage refusal scope
View the source data here.
The scope of refusal provisions for contraceptives fell into four categories: limited, broader, expansive, and almost unlimited.
States without a scope had no score change, so "limited" scopes earned a deduction of one point, broader -2, expansive -3, and almost unlimited -4.
States which specified that enrollees should be notified of these provisions were given one point back.
Minors' Access to Contraceptive Services
View the source data here.
This data lists five specific cases under which states grant minors access to contraceptive services, including an "other" case. States were granted one point per scenario where minors are granted access.
There is also a column which indicates when a state explicitly allows all minors access to these services. States under this category were given 6 points to indicate a higher level off access than states which granted access in all five specific cases.
States without explicit policies were given no points.
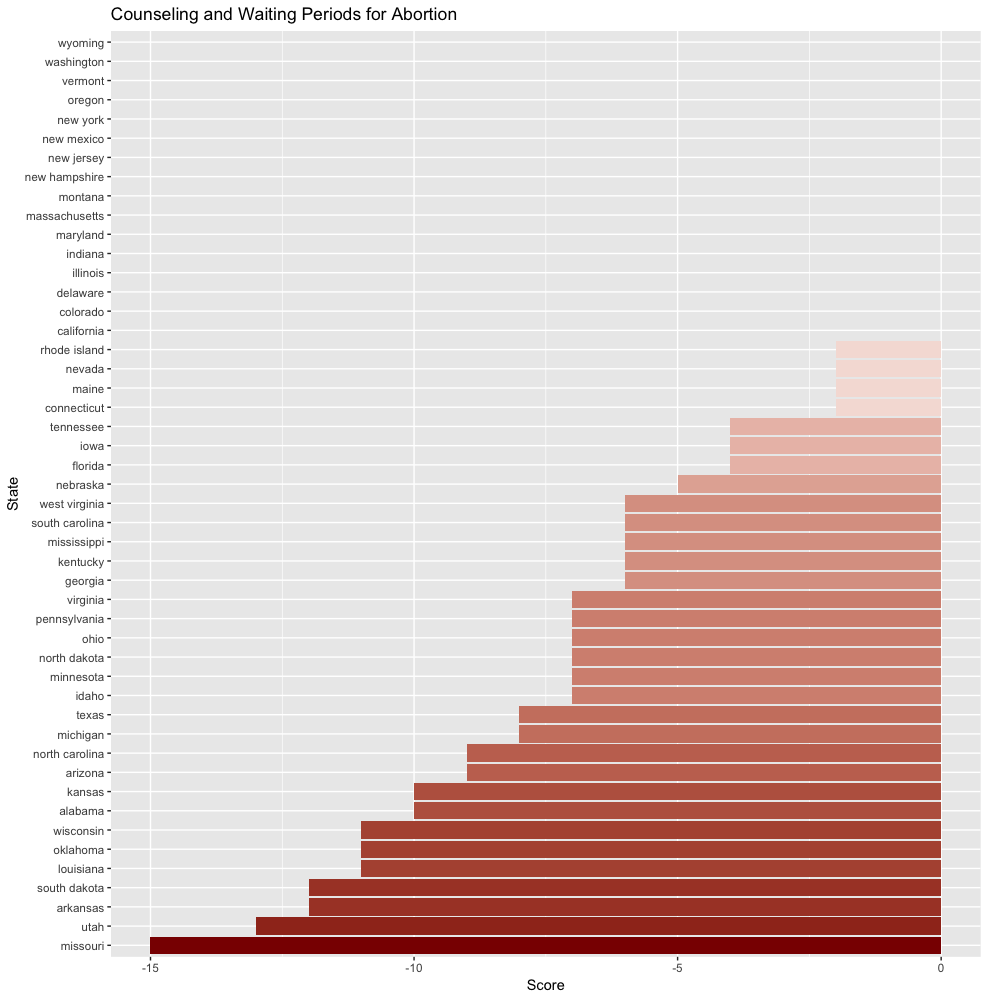
Counseling and Waiting Periods for Abortion
View the source data here.
This data was divided into two tables: overall details of the consultation and waiting periods, and objective accuracy of the information given regarding the health risks of both abortion and continuing pregnancy. The second table has been covered in its own chart and methodology (below.)
The first table has columns which represent practices which all act, in their own ways, as deterrents to women going through with the procedure.
Most of these columns can be scored in the straighforward "one mark deducts one point" method used with other datasets. There are a few exceptions, which I will detail below:
The first column details waiting periods, which range from zero to three days. States lost one point per day in the waiting period, with a three-day wait earning -3 points.
The third column, "Written Materials Given or Offered," also called for more specific scoring. If written materials are offered, this earned the standard one-point deduction given for any other mark in the table. If they are given, this earns -2 points, as it gives the patient no option to refuse.
Lastly, some procedures are indicated as being fulfilled both in written and verbal form rather than one or the other. Those states with both methods in one category earned -2 points, one per delivery method.
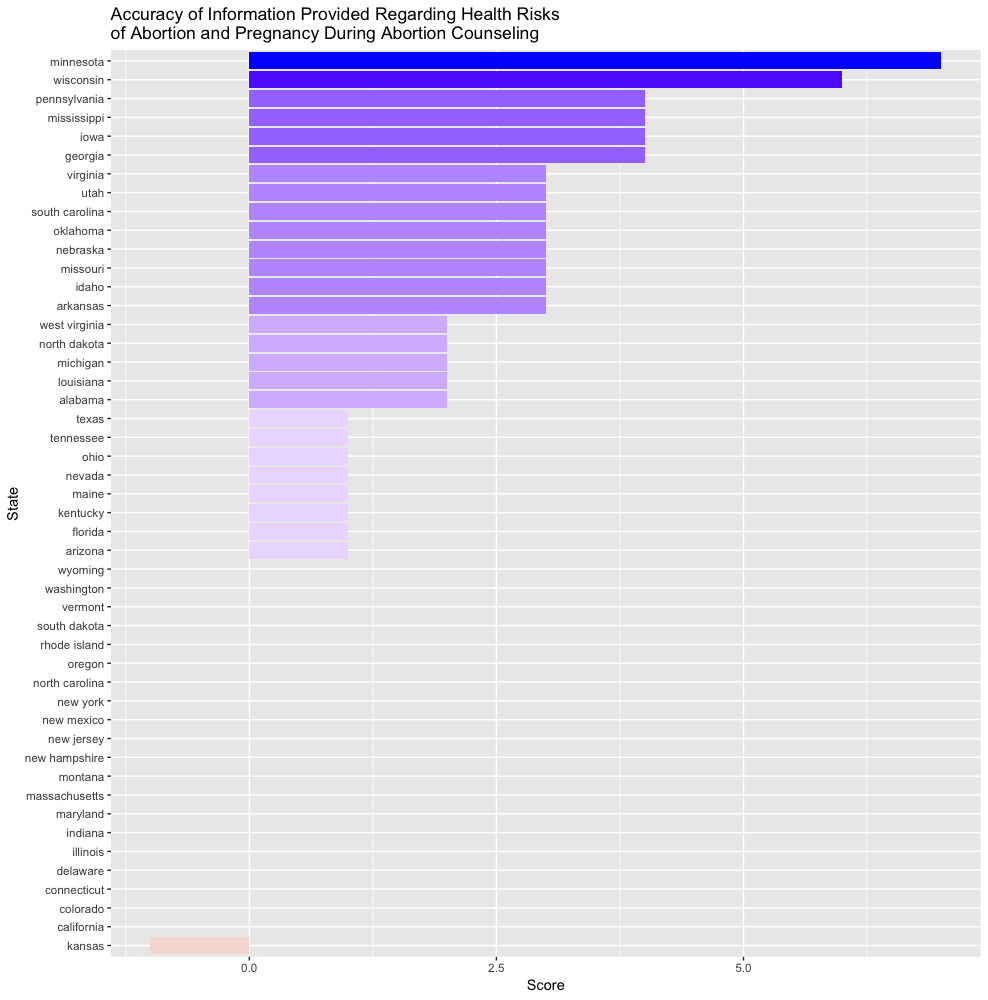
Accuracy of information regarding health risks
View the source data here.
States were given the opportunity to earn one point for each case where they potrayed information accurately during counseling. One point was deducted for each case where inaccurate information was given.
As with the previous dataset, indications of verbal and written delivery methods were given separate scores per category.
Finally, detailing the risks of continuting pregnancy added points to a state's score.
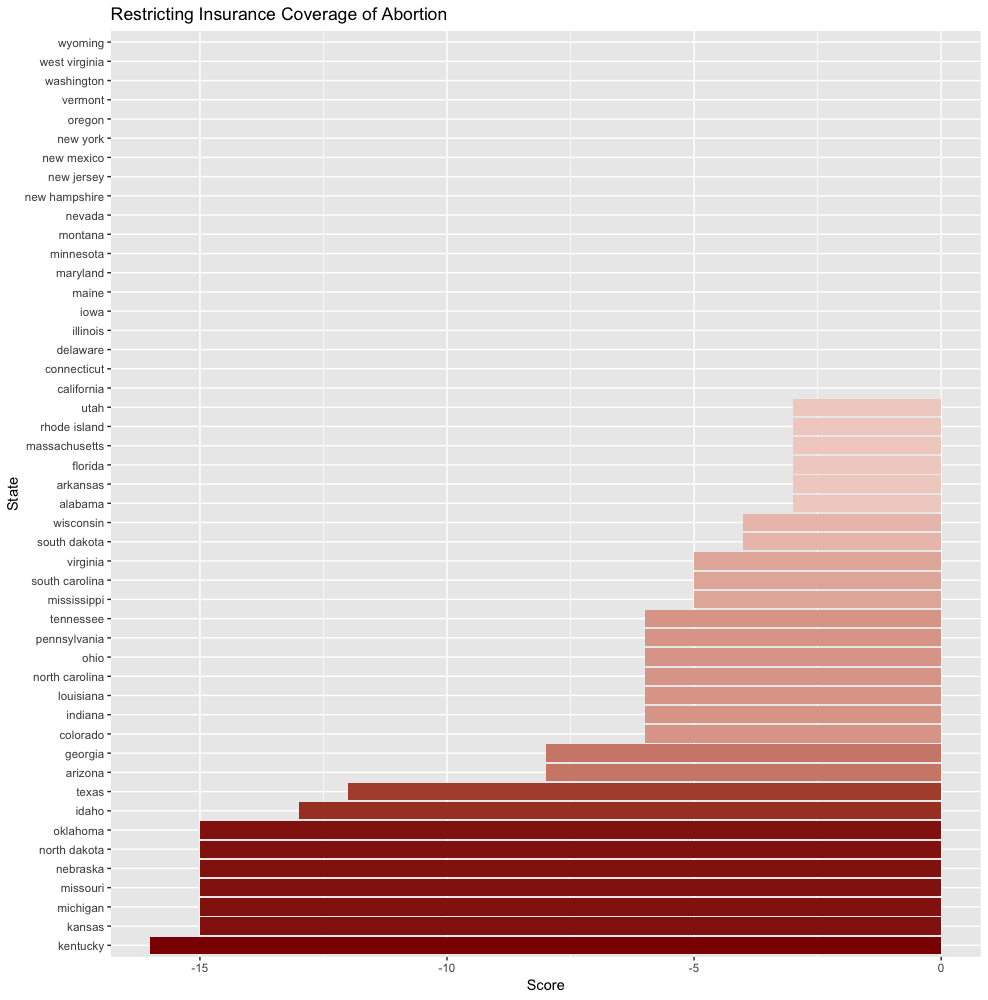
Restricting Insurance Coverage of Abortion
View the source data here.
In this dataset, scores were allocated based off of the state with the widest range of exceptions to their restrictions: Utah.
Utah allows insurance coverage of abortion in cases of Life, Rape, Incest, Severe health, and Fetal impairment.
While Utah will still have a point deducted for each of the three dataset's categories, as it has a limitation there in the first place from which to make exceptions, it represents the "best of the worst." Other states start with -6 points in each category where it has limitations, and earn one point back per exception made.
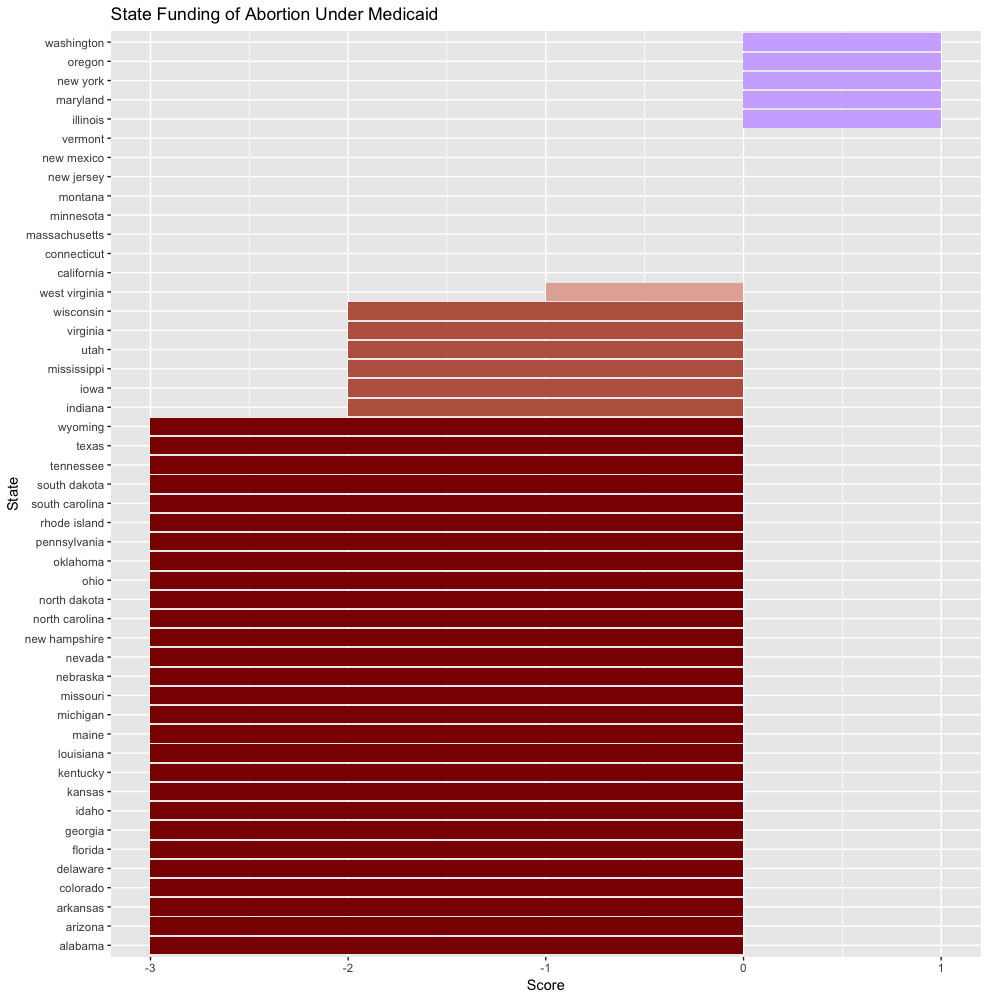
State Funding of Abortion Under Medicaid
View the source data here.
In cases of states which only fund abortions in specific cases, scores are again allocated based on the state with the most additional exceptions granted. In this instance, that state is West Virginia, which makes additional exceptions for cases of physical health and fetal impairment.
Like in the previous dataset, West Virginia still earns -1 point. So, states which follow the basic federal standard earn -3 points, and can earn one point back per additional exception made.
States which fund all or most medically necessary abortions voluntarily gain 1 point, and those who do so because of a court order neither earn nor lose any points.
Total Scores
Total scores for each state were determined by calculating the sum of its scores given in each above category.
Process
Setup
library(tidyverse) library(ggplot2) library(mapproj) library(dplyr)
Creating a theme for the map
#Theme from: https://socviz.co/appendix.html#appendix theme_map <- function(base_size=9, base_family="") { require(grid) theme_bw(base_size=base_size, base_family=base_family) %+replace% theme(axis.line=element_blank(), axis.text=element_blank(), axis.ticks=element_blank(), axis.title=element_blank(), panel.background=element_blank(), panel.border=element_blank(), panel.grid=element_blank(), panel.spacing=unit(0, "lines"), plot.background=element_blank(), legend.justification = c(0,0), legend.position = c(0,0) ) }
Loading a data frame of state map data and assigning scores by state, refferred to as "region" in the map_data, and removing the District of Columbia.
states <- map_data("state") state_scores <- left_join(states, womens_reproductive_rights_ranking_flipped) state_scores %>% filter(!region %in% "district of columbia") -> state_scores
Reducing the state data to one row per state
reductionTest <- dplyr::distinct(state_scores) reductionTest <- distinct(reductionTest) reductionTest2<-reductionTest %>% group_by(region) %>% summarise() reductionTest3<-left_join(reductionTest2, womens_reproductive_rights_ranking_flipped)
Emergency Contraception Policies
ecpChart<-ggplot(data=reductionTest3, aes(x=reorder(region, emergencyContraceptionPolicies), y=emergencyContraceptionPolicies, fill=emergencyContraceptionPolicies)) + geom_bar(stat = "identity") + scale_fill_gradient2(low = "darkred", mid = "white", high = "blue") + coord_flip() + labs(title="Emergency Contraception Policies\nScored on amount of Expansion/Restriction of Access", x="State", y="Score") + guides(fill=FALSE)
Policies allowing providers to refuse
refusalChart<-ggplot(data=reductionTest3, aes(x=reorder(region, providerRefusal), y=providerRefusal, fill=providerRefusal)) +
geom_bar(stat = "identity") +
scale_fill_gradient2(low = "darkred",
mid = "white",
high = "blue") +
coord_flip() +
labs(title="Policies Allowing Providers to Refuse Health Services", x="State", y="Score") +
guides(fill=FALSE)
Nurses’ Authority to Prescribe or Dispense
nurseChart<-ggplot(data=reductionTest3, aes(x=reorder(region, nurseAuth), y=nurseAuth, fill=nurseAuth)) +
geom_bar(stat = "identity") +
scale_fill_gradient2(low = "darkred",
mid = "white",
high = "blue") +
coord_flip() +
labs(title="Nurses' Authority to Prescribe or Dispense Contraceptives \nand STI Medication", x="State", y="Score") +
guides(fill=FALSE)
Protecting Confidentiality for Insured Dependents
confidentialChart<-ggplot(data=reductionTest3, aes(x=reorder(region, depConfidentiality), y=depConfidentiality, fill=depConfidentiality)) +
geom_bar(stat = "identity") +
scale_fill_gradient2(low = "darkred",
mid = "white",
high = "blue") +
coord_flip() +
labs(title="Protecting Confidentiality for Insured Dependents", x="State", y="Score") +
guides(fill=FALSE)
Insurance Coverage of Contraceptives
insCoverContChart<-ggplot(data=reductionTest3, aes(x=reorder(region, insCoverContraception), y=insCoverContraception, fill=insCoverContraception)) +
geom_bar(stat = "identity") +
scale_fill_gradient2(low = "darkred",
mid = "white",
high = "blue") +
coord_flip() +
labs(title="Insurance Coverage of Contraceptives", x="State", y="Score") +
guides(fill=FALSE)
Coverage refusal scope
coverageRefusalChart<-ggplot(data=reductionTest3, aes(x=reorder(region, covRefusalScope), y=covRefusalScope, fill=covRefusalScope)) +
geom_bar(stat = "identity") +
scale_fill_gradient2(low = "darkred",
mid = "white",
high = "blue") +
coord_flip() +
labs(title="Insurance Coverage Refusal Scope for Contraceptives", x="State", y="Score") +
guides(fill=FALSE)
Minors' Access to Contraceptive Services
minorAccessChart<-ggplot(data=reductionTest3, aes(x=reorder(region, minorsContAccess), y=minorsContAccess, fill=minorsContAccess)) +
geom_bar(stat = "identity") +
scale_fill_gradient2(low = "darkred",
mid = "white",
high = "blue") +
coord_flip() +
labs(title="Minors' Access to Contraceptive Services", x="State", y="Score") +
guides(fill=FALSE)

Counseling and Waiting Periods for Abortion
waitingChart<-ggplot(data=reductionTest3, aes(x=reorder(region, waitPeriod), y=waitPeriod, fill=waitPeriod)) +
geom_bar(stat = "identity") +
scale_fill_gradient2(low = "darkred",
mid = "white",
high = "blue") +
coord_flip() +
labs(title="Counseling and Waiting Periods for Abortion", x="State", y="Score") +
guides(fill=FALSE)
Accuracy of information regarding health risks
infoAccuracyChart<-ggplot(data=reductionTest3, aes(x=reorder(region, infoAccuracy), y=infoAccuracy, fill=infoAccuracy)) +
geom_bar(stat = "identity") +
scale_fill_gradient2(low = "darkred",
mid = "white",
high = "blue") +
coord_flip() +
labs(title="Accuracy of Information Provided Regarding Health Risks \nof Abortion and Pregnancy During Abortion Counseling", x="State", y="Score") +
guides(fill=FALSE)
Restricting Insurance Coverage of Abortion
insuranceRestrictionChart<-ggplot(data=reductionTest3, aes(x=reorder(region, insuranceRestriction), y=insuranceRestriction, fill=insuranceRestriction)) +
geom_bar(stat = "identity") +
scale_fill_gradient2(low = "darkred",
mid = "white",
high = "blue") +
coord_flip() +
labs(title="Restricting Insurance Coverage of Abortion", x="State", y="Score") +
guides(fill=FALSE)
State Funding of Abortion Under Medicaid
stateFundingChart<-ggplot(data=reductionTest3, aes(x=reorder(region, stateFunding), y=stateFunding, fill=stateFunding)) +
geom_bar(stat = "identity") +
scale_fill_gradient2(low = "darkred",
mid = "white",
high = "blue") +
coord_flip() +
labs(title="State Funding of Abortion Under Medicaid", x="State", y="Score") +
guides(fill=FALSE)
Total Scores and Mapping
Total Score Graph
totalChart<-ggplot(data=reductionTest3, aes(x=reorder(region, totalScore), y=totalScore, fill=totalScore)) +
geom_bar(stat = "identity") +
scale_fill_gradient2(low = "darkred",
mid = "white",
high = "blue") +
coord_flip() +
labs(title="Overall State Support of Women's Reproductive Rights\nHighest to Lowest", x="State", y="Score") +
guides(fill=FALSE)

Total Score Map
This page from Socviz was used as reference to make this map.
map0 <- ggplot(data = state_scores,
aes(x = long, y = lat, group = group, fill = totalScore))
map1 <- map0 + geom_polygon(color = "black", size = 0.1) +
coord_map(projection = "albers", lat0 = 39, lat1 = 45)
map2 <- map1 + scale_fill_gradient2(low = "darkred",
mid = "white",
high = "blue") +
labs(title = "Support vs. Hostility of State Legislation on Women's Reproductive Rights")
map2 + theme_map() + labs(fill = "Score")
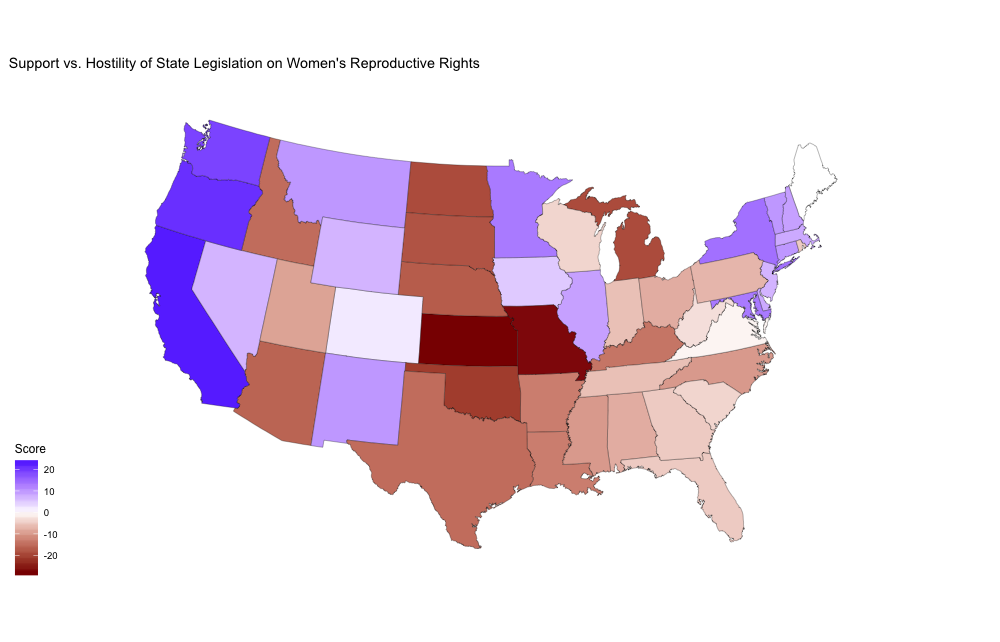
Conclusion
My hypothesis was proven correct to an extent -- the states which have had the focus of the media did present an overall negative score. However, the degree of their hostility is nowhere near that of states like Missouri and Kansas, which seem to have flown "under the radar."